Radical
Statistics
Deconstructing Welfare Dependency: the case of Australian welfare reform
Paul Henman
On 29 September 1999, the then Australian Minister for Family and Community Services, Senator the Honourable Jocelyn Newman, announced during a National Press Club Speech a major review of Australias social security system (Newman 1999a). The key reason given in this speech and in the subsequent Government Discussion Paper for the need for policy reform was the existence and increase in welfare dependency created by a passive welfare system (Newman 1999b).
Despite a lack of definition for welfare dependency, the government repeatedly presented statistics on changes in the number of workforce-age social security recipients to support its claim there has been an increase in welfare dependency. This paper critically examines those statistics for what they might reflect.
Defining welfare dependency
It is telling that despite the centrality of welfare dependency to the Governments policy reform programme, not one government document seeks to define the term or provide a framework for understanding how one may become welfare dependent. The popular use of welfare dependency is pejorative, implying that a person who is welfare dependent is passive, lazy, unnecessarily reliant and work-shy. In short, such people fail to help themselves.
The governments occasional use of indicators other than a simple recipient count, such as the percentage of income from government and the length of benefit receipt, suggests that it is groping towards a more nuanced conception of welfare dependency. However, its failure to tackle the varied meanings of welfare dependency means that the policy analysis and prescription remains confused. It is, of course, highly possible that the government chooses to remain ambiguous about its use of welfare dependency for political purposes.
Deconstructing recipient numbers
The key figure used in many government documents to show how welfare dependency has increased is Figure 1. In contrast, it is argued here that the factors underlying the obvious long-term, upward trend in workforce-age social security recipient numbers are artefactual, definitional and structural, and not due to people being lazy or making the most of loose regulations as the government implies.
Click HERE for Figure 1: Artefactual distortions of recipient statistics
If recipient statistics are to be used to obtain a sense of underlying social changes, it is necessary to remove artefactual distortions created by social policy changes. The governments figures remove one such problem by counting each person of workforce age who either directly or indirectly receives a social security payment. In particular, two adults are counted when partnered men receive support for both himself and his spouse. However, a few significant artefactual distortions remain.
The governments welfare recipient statistics (Figure 1) exclude war veterans (and their wives and war widows) in receipt of Service Pensions, presumably on the basis that they are the deserving poor or that their war-induced disability does not enable them to work (1). Although a fine sentiment, their exclusion distorts recipient statistics. In particular, the cohort decline in the Service Pension population from the mid 1980s to 1990 from people reaching Age Pension age, involved a corresponding increase in Disability Support Pension numbers. In other words, the Service Pension acted as a special Disability Support Pension for war veterans. In which case, the Service Pension recipients should be included in recipient statistics to avoid an artefactual distortion. Figure 2, Adjustment 1 shows the effect on Figure 1 by including recipients of Service Pensions (2). This revision suggests that the Governments graphs understate both the level of welfare receipt until 1990 and the growth in recipient numbers resulting from the recessions of the late 1970s and early 1980s.
Click HERE for Figure 2
Artefactual distortions have also resulted from increased generosity of the social security system. Although many of these changes have had marginal impact on overall recipient numbers, the 1995 extension of Parenting Allowance to parents partnered to low-wage workers significantly increased client numbers. Apart from the artefactual distortion, the inclusion of these recipients is problematic for another reason. Given that the measure is essentially an in-work benefit it hardly makes sense to classify these recipients as welfare dependent, if this is to mean lazy and work shy. Figure 2, Adjustment 2 presents the result of excluding Parenting Allowance for low-income households from the recipient count. Although the adjustment has little effect on the broad historical trend, it significantly shows that the apparent rise in welfare dependency from 1995 is largely a result of this in-work benefit, poverty-reduction measure.
Definitional problems with recipient statistics
To the extent that recipient numbers are used to reflect levels of welfare dependency, the inclusion of the Carer Pension (now Carer Payment) in welfare dependency statistics is rather odd. Given a major purpose of the payment is to facilitate caring in the community, the Carer Pension provides a means by which people with disabilities can be cared for in their home. This payment enables government to reduce expenditure on institutional care and has been an important element in the 1980s and 1990s process of deinstitutionalisation. Because of this, and the fact that many carers would be otherwise in work if not for their caring activities, it is inappropriate to consider recipients of Carer Pension as welfare dependent if this is to mean lazy or work shy. However, Figure 2, Adjustment 3 shows that removing recipients of Carer Payment has only a marginal effect on overall workforce-age client numbers.
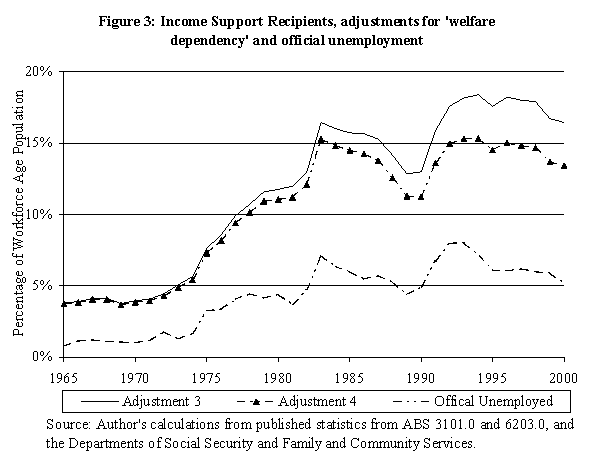
The Governments welfare dependency statistics also include recipients receiving part-rate payments. People receive part-rate payments because of a modest amount of private income from part-time or casual work. Accordingly, it is somewhat problematic to consider such people welfare dependent if this is to mean lazy or work shy. Because of significant changes in the labour market Figure 3, Adjustment 4 shows that the effect of removing part-rate recipients from the recipient count is quite significant (3). (For reference, Figure 3, Adjustment 3, reproduces Adjustment 3 in Figure 2.) Importantly, it suggests that when the economic cycle is taken into account, there has not been an increase in welfare dependency since the early 1980s.
Click HERE for Figure 3
The above adjustments represent an attempt to remove the major distortions in using recipient statistics to measure welfare dependency. More specifically, Figure 3 Adjustment 4 broadly measures recipients who do not have a close attachment to the workforce. Welfare dependency measured in this way significantly increased in the late 1970s, with a cyclical pattern in evidence since then.
If by welfare dependency we mean lazy and work shy, it would desirable to further adjust these data by restricting the recipient count to those in receipt of income support for an extended period of time, such as greater than twelve months. Unfortunately, such data are not readily available. However, even though a more acute increase would be expected, it is argued that they are due to the same factors as those outlined below, and not to do with growing dependency culture.
Interpreting the data
Given the recipient data presented above have been adjusted to remove artefactual and definitional distortions, what explains the changes that have occurred since 1965? Do they reflect an increase in a welfare dependency culture as the Government has argued (ie a moral failure), or a skill failure as the Welfare Reform Reference Group has argued (Australia 2000), or are other factors more salient?
Economic cycles
It is well known that economic cycles effect aggregate levels of employment. The economic downturns of the late 1970s, early 1980s and early 1990s led to reductions in employment and increases in unemployment, as is illustrated in Figures 3 and 4.
The dynamics of the economic cycle would suggest that unemployment numbers should return to pre-recession levels when growth returns. However, Figure 4 suggests a ratcheting-up of the natural rate of unemployment. This is observed in many western countries. Labour market economists suggest that this may be due to skill atrophy amongst unemployed persons or to structural changes in the labour market and economy.
Labour market change
Since the late 1970s, there has been significant structural labour market change in Australia partly as a result of labour market deregulation and a decade of organisational downsizing. These changes, in common with other OECD countries, include significant declines in manufacturing and low-skilled jobs, and a growth in service sector and high-skilled jobs. Part-time work has grown, but full-time work has declined. Policy changes in response to this changed environment have made it easier for social security recipients to combine part-time work with part-rate of payment. Given these complex changes, how might one measure the extent to which changes in the social security population result from structural unemployment?
For this purpose, the government has used the official unemployment rate (4). Using a version of Figure 4, the Minister (Newman 1999b, 5) argued that the increasing gap between the unemployment rate and total recipient numbers, meant that the rise in recipient numbers was only partially attributable to a lack of jobs and was thus evidence of an increase in passive welfare dependency.
This argument is problematic because the measured unemployment rate understates the lack of jobs. Firstly, the unemployment measure does not include a large number of people who want work, but who are either not actively looking for work (ie discouraged jobseekers) or who are not available to work in the surveyed week (eg due to temporary illness, educational commitments, limited childcare). In September 2000, these people with marginal labour force attachment constituted about nine percent of the workforce age population (ABS 2000b). Secondly, as the employment rate includes anyone with one hour or more a week of employment, there are an increasing number of people in employment who are also receiving social security benefits to support their part-time wages.
A step towards taking account of these factors could involve comparing only full-rate recipients (Figure 3, Adjustment 4) with the summation of the unemployed and those marginally attached to the labour force. Such a comparison would suggest that the lack of jobs explains most of the increase in receipt of social security.
Job vacancy statistics provides an alternative way to assess the extent to which income support receipt is due to of a lack of jobs. In particular, since the late 1970s there has been on average ten unemployed persons for every job vacancy (ABS 2001b). However, in using these data, we must also be aware that they do not take account of the rise of skill-mismatch (whereby available jobs require skills that unemployed persons do not have) or the existence of jobs in locations where there are no appropriately skilled workers.
The Welfare Reform Reference Group provided another way in which to broadly assess the extent to which changes in the income support receipt reflect labour market change. The Group presented a version of Figure 4 without the part-time employment rate (shaded area) to argue that increased recipient numbers alongside a stable level of joblessness indicates increased dependency (Australia 2000, 10). However, as income support recipients include part-time workers, it is necessary to include part-time work in the comparison. When this is done, the enormous growth in part-time employment appears to explain a great deal of the rise in recipient numbers. However, as many part-time workers do not receive social security benefits, this overstates the explanatory force of part-time work.
There are three reasons why the significant growth in part-time jobs has not made an impact on levels of receipt of social security. Firstly, because people can combine a part-time wage with a part-rate benefit, people on benefit who get part-time work will not necessarily cease eligibility to benefit. This shift involves only a small decline in social security numbers. Secondly, the growth in part-time work has been accompanied with the loss of full-time jobs and does not represent additional jobs. Thus, the effect is of a full-time worker receiving no benefits becoming a part-time worker receiving part-rate benefits, namely an increase in social security recipients. Thirdly, many new part-time workers were previously unemployed female partners to male full-time workers. Because Australias social security system takes account of a partners income, the unemployed woman would be ineligible, beginning part-time employment has no effect on the social security system.
Household composition
Over the last three decades there has been a significant growth in single-adult households. This trend increases the number of households and individuals receiving income support. It is a statistical fact that one-adult households are more likely than two-adult households to have no adult in employment.
Put in another way, consider the breadwinner model dominant prior to the 1980s. The full-time working male provides the financial support for his female partner who is not employed. In this scenrio, no income support is paid. The trend to more single-adult households would see this arrangement re-constituted into a single male full-time worker and an unemployed female receiving income support payment; a net increase in social security.
A shift away from the breadwinner model and two-adult households combines with labour market change to create a potent force increasing levels of social security receipt, as is schematically presented in Table 1. People tend to have partners with a similar skill and educational level. Labour market restructuring has undermined work opportunities in low-skilled households whilst heightening opportunities for high-skilled households, thereby leading to a rise of dual and no-income households and increases the need for income support. Increasing levels of single-adult households (indicated by the dotted line in Figure 1) further increases the need for income support.
Table 1: Changes in household structure, employment and income support receipt
| Pre 1980s | Post 1980s |
| High skilled household | |
| X full-time job C unpaid domestic work no income support | X full-time job no income support |
| C full-time or part-time job, no or part income support | |
| Low skilled household | |
| X full-time job C unpaid domestic work, no income support |
FACE="Arial Narrow Special G2">X unemployed 1 income support payment |
|
FACE="Arial Narrow Special G2">C unpaid domestic work 1 income support payment |
Population ageing
It is well known that most western countries face increasing numbers of older people and an increasingly ageing population structure. Natalie Jackson (1999) has assessed the cohort effects on recipient numbers for the major social security benefits. She found that, with the exception of the Age Pension, cohort effects have had only a small effect on recipient numbers. The biggest effect has been for the Sole Parent Pension, accounting for almost four per cent of the increase from 1971 to 1997. In contrast, since 1992 the cohort effect has contributed a small reduction to unemployment beneficiaries. Contrary to general opinion, population ageing has not contributed to the large rise in Disability Support Pensioners.
Conclusion
There can be no doubt that workforce-age recipient numbers have increased considerably since the mid-1960s. The key policy question is, what is the reason for this increase? Contrary to the governments argument that there has been an increase in passive welfare dependency, the increase is due to changes in the economy, the labour market and household composition. Indeed, a recent publication of the Australian Bureau of Statistics states:
This increase [in income support receipt by the workforce-age population] is largely associated with: sustained declines in full-time employment and increased levels of unemployment, particularly among young people and those just below retirement age; increasing proportions of people without partners in general, and lone parents in particular; and increasing levels of education participation among young people (ABS 2001a, 166).
Given that these are the primary factors for increased benefit receipt in Australia, they raise considerable questions about the efficacy of active welfare and Third Way policy solutions that focus on individuals. To the extent that other OECD countries share similar socio-economic trends underlying increased welfare receipt, these observations have implications for social policy development more broadly.
Notes
This paper represents an extensive revision of the authors submission to the Welfare Reform Reference Group. My great appreciation goes to Adrian Sinfield and to two anonymous reviewers, who provided thoughtful comments on an earlier version of the paper, and to Natalie Jackson who generously provided me with some of the statistics used.
- The Governments welfare dependent statistics also omit recipients of educational allowances. Presumably this is because full-time students are enhancing their employability and so are not regarded as welfare dependent.
- Unfortunately, I have not been able to precisely reproduce Figure 1, but the base line data are significantly similar.
- As there are also full-rate recipients with some earnings, this adjustment understates the level of workforce participation by income support recipients. As part-rate recipient data are sketchy, calculations are based on a best guess using a small sample of years.
- Australias unemployment statistics are based on a national survey on labour force participation and not on benefit numbers. The survey defines a person as unemployed if they are 15 years and over, currently available and looking for work and did not work for one hour or more in the week prior to being surveyed (ABS 2000a).
References
Australia, Reference Group on Welfare Reform (2000) Participation Support for a More Equitable Society, Interim report, Volume 2: Technical and Other Appendices, Department of Family and Community Services, Canberra.
Australian Bureau of Statistics (ABS) (2000a) Labour Force, Australia, Preliminary, Catalogue No. 6202.0, Canberra.
Australian Bureau of Statistics (ABS) (2000b) Persons Not in the Labour Force, Australia, Catalogue No. 6220.0, Canberra.
Australian Bureau of Statistics (ABS) (2001a) Australian Social Trends 2001, Catalogue No. 4102.0,
Australian Bureau of Statistics (ABS) (2001b) Job Vacancies, Australia, Catalogue No. 6354.0, Canberra.
Department of Family and Community Services (FaCS) (1999) Trends in pension and benefit receipt, Research FaCS Sheet, Number 2, Canberra.
Jackson, Natalie (1999) Understanding population ageing: a background, Australian Social Policy, No. 1, 203-224.
Newman, Jocelyn (1999a) The Future of Welfare in the 21st Century, speech given at the National Press Club, Canberra, 29 September.
Newman, Jocelyn (1999b) The Challenge of Welfare Dependency in the 21st Century, Discussion Paper prepared for Welfare Reform Reference Group, Department of Family and Community Services, Canberra.
Paul Henman
Department of Sociology
Macquarie University, Sydney NSW 2109
Australia
Tel: +61 2 9850 8239
Fax: +61 2 9850 9355
email Paul.Henman@mq.edu.au