Radical
Statistics
Unemployment: How Official Statistics Distort Analysis and Policy, and Why
David Webster
Minor corrections were made to this article on 8 May, 2012 at the request of the author.
The current state of British official unemployment statistics fully vindicates the concerns of the statisticians who launched Radical Statistics 27 years ago - "a common concern about the political implications of their work and an awareness of the actual and potential misuse of statistics". Indeed this is probably a more graphic example than any contemplated at that time, which was something of a golden age for British official statistics.
The official statistics represent British unemployment as much lower than realistically it is, by concealing the scale of disguised unemployment. They also misrepresent its geography, obscuring its high degree of concentration in the former industrial cities and coalfields. These twin misrepresentations in turn obscure the scale of the impact of industrial job loss, and particularly of Britains exceptionally poor performance in manufacturing and of the disproportionate loss of manufacturing jobs from cities. These basic misrepresentations have in turn made it easier, over the last few years, to deploy invalid job vacancy data to argue that employment opportunity is equally distributed throughout the country, although to its credit ONS has acted relatively quickly to attempt to prevent this particular misuse.
The effect of these various misrepresentations is systematically to undermine the ability of the political system to produce relevant policy action, even though the present government has made unemployment a priority.
The two issues of the level of unemployment, and its geography, are interlinked and it is difficult to understand one without the other. It is best to start with the geography.
How the statistical misrepresentations work - the geography of unemployment
It is well known that the claimant count is misleadingly low. It includes only people entitled to unemployment-related benefits; it has been reduced substantially since the 1970s by successive administrative changes; and very large numbers of unemployed people have moved out of "unemployment" into other categories, particularly sickness. Nevertheless, because it is a count rather than a sample, claimant unemployment delivers usable information about every area. More important, it is generally a good guide to the relative level of unemployment between areas. In this respect it does not differ much from the ILO measure, which includes people looking for work but not entitled to unemployment-related benefits. Across local authority areas, the correlation between the two measures is 0.88.
At January 2001 claimant unemployment varied across the 408 local authorities in Great Britain by a factor of 30, from 0.4% in Mole Valley, Surrey to 11.8% in Knowsley on Merseyside (Webster 2001a). Not only are these differentials very great; they are almost completely static. The correlation across local authorities between Census unemployment in April 1991 and claimant unemployment in July 2000 was 0.92. In other words, with few exceptions, if an area had high unemployment a decade ago then it still has high unemployment now. There has been little or no "convergence" in terms of rankings.
Click HERE for Map 1a.
Click HERE for Map 1b.
MAPS 1A and 1B show the geography of claimant unemployment in England and Scotland at January 2000. The categories have been chosen to distinguish areas with an average level, those with more than double or less than half the average, and those in between. The areas with more than double the national rate are mainly industrial conurbations, including inner east and south London, Birmingham, Manchester, Liverpool, Hull, Tyneside, Teesside, Glasgow, Clydebank and Dundee. Over 90% of all the unemployed people living in areas with unemployment more than double the national average are found in cities; because these are populous areas, the number of people involved is very large. Some seaside areas are also relatively bad, partly because in January their unemployment is seasonally high.
The pattern of unemployment in MAPS 1A and 1B is quite different from that shown by the ONS statistics for local authorities and parliamentary constituencies published in the official Labour Market Trends. The latter, introduced from 1996, use an invalid denominator compounded of unemployed people who live in the area and employed people who work in it but often live elsewhere. The resulting figures have no meaning and cannot validly be used for any purpose, as indeed was recognised by the Department of Employment (DE) and its predecessors and clearly stated in print in 1960, 1968, 1978 and 1979. In the present context, their most important feature is that they greatly understate unemployment in the cities, precisely where the problem is greatest. For instance, in the Glasgow area they regularly make the prosperous suburb of East Renfrewshire appear to have a higher unemployment rate than the city itself. This is because cities have net in-commuting, so that the resident unemployed are shown as a percentage of an employed workforce which is inflated by people working in the area but resident elsewhere.
Because the invalidity of the "workforce" rates is so blatant, one might hope that they would be widely ignored. Unfortunately this is not the case. Journalists take them from "NOMIS" (which does not carry an effective health warning) and they are used regularly even in heavyweight papers such as the Financial Times. No newspaper has adopted a policy of not using them. Also, individual local authorities often quote these rates when it is in their interest to do so: being able to say, for instance, that the area has "the highest unemployment rate in Scotland" is useful in arguing for resources. Even a local authority consortium such as SLIMS (Strathclyde Labour Market Information Service) feels obliged to carry the figures.
The misrepresentation created by the "workforce" rates is mitigated by the publication of International Labour Office (ILO) rates, produced from the Labour Force Survey, for local authority areas. These do show very high rates in the cities. But the ILO rates only partly undo the damage because they are available quarterly for only about 30 authorities and annually for 120, and the figures have substantial sampling errors for individual years and quarters.
In practice, also, government departments do actually use the "workforce" rates. One recent use was in the recent review of UK Assisted Areas, as one of four indicators to select eligible wards (some subsequent adjustments did not alter the fundamental methodology) (DTI 1999). Since one of the other indicators was the percentage of manufacturing employment, with more manufacturing treated as an indicator of economic weakness, the overall effect was to divert Regional Selective Assistance away from cities with high unemployment to areas such as new towns with relatively low unemployment.
Another use was by HM Treasury (2000) in attempting to construct an argument that high unemployment in the inner London "scimitar" could not be due to lack of labour demand because "two of the ten areas of lowest unemployment in the country" - the Cities of London and of Westminster - also lay nearby. Both are very badly affected by the errors in the "workforce" rates, having respectively 109 times and 6 times as many workers as employed residents in 1991 (Webster 2000b). Westminster was shown as having 1.1% unemployment in July 1999, but the true resident rate was actually about 6.2%, well above the national average. The City of Londons rate was shown as "0.0", its 94 unemployed claimants being swamped by the huge in-commuting "workforce", but its true rate was about 3.6%, below the national average but nowhere near the lowest 10.
A further use by HM Treasury, with the Department of Work and Pensions (DWP), in connection with lone parenthood, will be discussed below.
Since Summer 2001, ONS has been reviewing the "workforce" rates using a working group with external membership. It is understood that it will now move to withdraw them, although no public announcement has yet been made. To its credit, the Scottish Executive has already parted company from Whitehall during the past 2 years, by largely replacing the "workforce" rates with its own rates using as denominator estimates of economically active persons derived from the LFS. [Author's note: Subsequent to the publication of this article, the Office for National Statistics accepted the invalidity of the local authority 'workforce' rates and discontinued their publication as from January 2003.]
"Travel to Work Areas" (TTWAs)
A further misrepresentation of the geography of unemployment arises from the use of "Travel to Work Areas" (TTWAs) to report claimant unemployment. It remains the case that no sub-regional claimant unemployment data are available for any date prior to April 1996 for any geography other than TTWAs, and many researchers are forced to use them. But TTWAs misrepresent the extent of local labour markets for the kind of people who are unemployed, conceal city concentrations of unemployment within larger areas, and understate unemployment for areas containing cities (Thomas 1998a, Webster & Turok 1997).
The "workforce" methodology which produces the invalid local authority and parliamentary constituency "rates" was invented in the 1920s as the only practical way of using the primitive data sources and information technology then available to produce approximate local unemployment estimates, originally for labour exchange areas in the Ministry of Labours Local Unemployment Index of 1927-39 (Garside 1980). TTWAs were first developed in the 1950s to reduce the inaccuracies in the "workforce" rates by grouping labour exchange areas where necessary to produce areas which had a reasonable balance of in- and out-commuting, or (less accurately) were "self-contained".
However, when TTWAs were put on to a systematic basis in 1968, the criterion of self-containment was pursued at the expense of internal cohesion. In other words, two places could be put in the same TTWA even if there was little or no commuting between them, as long as there was little commuting between either of them and other places. The claim that they constitute "approximations to local labour markets" has therefore always been spurious. With the growth of long distance white collar commuting into city centres, TTWAs centred on cities have become very large - indeed, even in 1961, the methodology was incapable of producing an unemployment rate for Greater London. Most of the important concentrations of unemployment have consequently been concealed.
ONS has not yet reformed DEs practice of concealing the errors in the TTWA rates from users. Commuting patterns are such that it is impossible to devise any mutually exclusive set of TTWAs of which a large number do not have serious imbalances between in- and out-commuting and therefore large errors in the resulting unemployment rates. Of the 297 current (1998) TTWAs in Great Britain, on the basis of the 1991 Census data used in their compilation, 60 had their July 1998 unemployment rate misstated by 0.5 percentage points or more. It is cities whose TTWA rates are most often understated.
Although estimates of these errors have been independently published (Green & Coombes 1985; Webster 1999), the Employment Gazette and Labour Market Trends have discussed the existence of this type of error only in general terms and have never carried any warning about particular TTWAs for which the errors are likely to be serious. As a result, certain places appear to have received government grant aid in respect of their purported unemployment which they should not have done.
There is also a longstanding problem about the treatment of armed forces personnel. In calculating the "workforce" for each TTWA, they are shared out between all the TTWAs pro rata to the size of their workforces. Most TTWAs have no armed forces personnel, but for the minority which do, this procedure results in an overestimation of the unemployment rate. The outstanding example of this problem used to be the Forres TTWA, whose labour force was the smallest in Scotland but which had a major military base (RAF Kinloss), as well as an excess of out-commuting over in-commuting. The result was to give Forres the third highest TTWA unemployment rate in Scotland at January 1996, and entitlement to government grants to address its supposed unemployment. However the Forres "unemployment blackspot" never existed. The Forres TTWA was merged into a larger area in 1998, but the problem still remains to a significant degree in this and other areas.
TTWAs and "workforce" rates have caused widespread damage to research on unemployment, both through their undisclosed errors and, in the case of TTWAs, by washing out variation within a small number of overlarge TTWAs accounting for a large share of the population. Many regression studies which have come up with the finding that local labour demand is not an important factor in unemployment, cannot be trusted for these reasons. Similarly, the purported investigation of geographical mismatch as a factor in unemployment by Layard et al. (1991, p.310) will have substantially underestimated mismatch, consequently giving too much support to the authors "supply-side" view.
How the statistical misrepresentations work - the level of unemployment
Under pressure particularly from the Royal Statistical Society (RSS), the present government in 1997 gave "preferred" status to the ILO measure of unemployment. This gives numerically a much higher figure than the claimant count - 0.61m greater at Autumn 2001. The switch has not resolved the problem of understatement of unemployment. This is partly because the government and Bank of England have subsequently taken to using the claimant count to make unqualified historical comparisons of the type "unemployment is now the lowest for a generation", ostensibly because the ILO measure is not available on the same basis prior to 1984. These comparisons are invalid because claimant unemployment does not mean the same now as it did in the 1970s. However, this is not the main issue, which is that the ILO measure itself is now very misleading. In Britain and many other countries, it excludes large numbers of people who on any reasonable view are unemployed.
Government Trainees
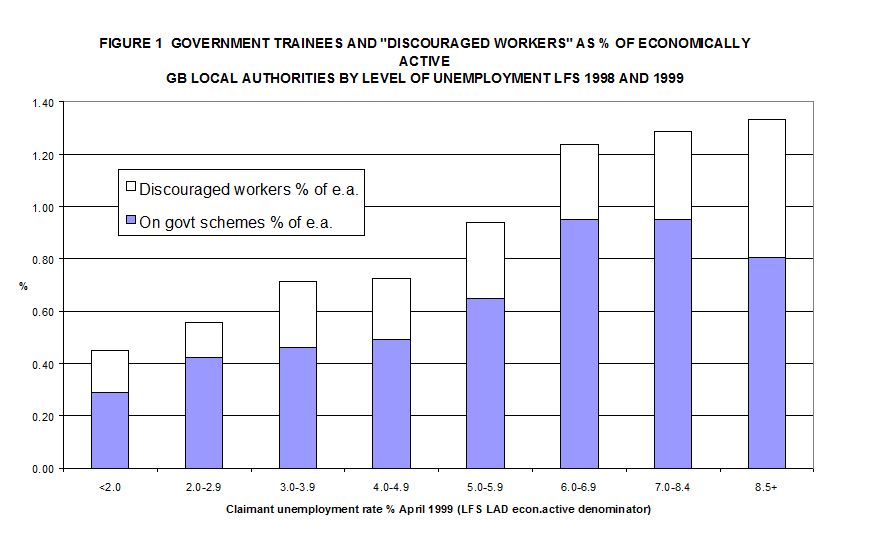
The ILO definition treats people on government training schemes for the unemployed as being employed. But if they were not unemployed, they would not be on a training scheme. This treatment both reduces the ILO figure, and distorts the geographical pattern. FIGURE 1, based on analysis of unpublished LFS data for 1998 and 1999, shows that the proportion of the "economically active" (i.e. employed or unemployed) who are on government schemes is greater, the higher is the level of unemployment. At the lowest levels of unemployment, adding those on government schemes would raise the ILO unemployment rate by under 0.5%; but at the highest level, it would add almost 1.0%. The LFS is known to undercount the number of people on schemes, by about half. So these figures should be approximately doubled.
Click HERE for Figure 1: Government Trainees and `Discouraged workers' as percentage of economically active
"Discouraged Workers"
To be ILO unemployed, a person must be looking for work. But what about people who want a job but have given up looking because they have decided the search is hopeless? There is international agreement that such "discouraged workers" - those who are not looking because they believe there are no suitable jobs available in their area - are really unemployed. FIGURE 1 shows that these workers views of their prospects are quite realistic: there are a lot more of them in high than in low unemployment areas. They would add only 0.2% to the ILO unemployment rate in the latter but over 0.5% in the former areas.
Together, government trainees and discouraged workers would add about 0.7% to the ILO unemployment rate in low unemployment, and around 1.5% in high unemployment areas. These figures would rise to around 1.0% and 2.0% respectively when allowance is made for undercounting of government trainees. These are significant amounts.
Unemployment disguised as sickness
Most of those discouraged by the state of their local labour market are to be found in the category of sickness. The evidence that a very large number of unemployed people in Britain are disguised as sick is very strong.
- Aggregate comparisons over time show a large increase in sickness in Britain which it is generally agreed cannot be explained by real change in health (NAO 1989; Gregg 1994; MacKay 1999; Fothergill 2001; HM Treasury 2001; Nickell & Quintini 2001). Figure 2 shows the huge increase of 1.6m since the later 1970s in the number of people claiming long term sickness benefits. Since 1996, the number of men claiming has begun to fall again, but the number of women is still rising and overall by February 2001 there had been a fall of only 53,000 from the peak. HM Treasury (2001) exaggerates the fall by pointing to Incapacity Benefit (IB) claims, when the real growth appears to be in the Disability Premium to Income Support.
- The UK has the highest rate of working age sickness of all 15 European Union (EU) countries. The UK rate of 7.0% compares with only 2.1% in Germany and 0.3% in France. FIGURE 3 shows that, as commentators frequently point out, Britain compares favourably with the rest of the EU in terms of ILO unemployment, with 8 countries having a higher rate. But if the working age sick were to be added to the unemployed, Britain would become the third worst, after Finland and Spain.
- Labour market accounts for the coalfields by Beatty et al. (1997) and for the cities by Turok & Edge (1999) and Bailey & Turok (2000), as well as a longitudinal study of coalminers by Fieldhouse & Hollywood (1999), have shown that for a high proportion of people affected by job losses, the consequence is not unemployment but economic inactivity, often sickness. Recent longitudinal analysis of the LFS (Young 2001, Figure 7) suggests that the propensity of the unemployed to move into inactivity rose steadily during the 1990s, from about 8% to 13% per quarter, while Erdem & Glyn (2001) separately show that employment rates for the least qualified quartile of men in the north and west of Britain continued to fall during the 1990s upswing even though unemployment rates were falling.
- The levels of sickness of the inactive sick are often similar to those of many people who are classed as employed or unemployed. In the 1991 Census, there were 1.286m people who had a self-reported limiting long term illness (LLTI) and were inactive due to permanent sickness. But there were also 0.701m employed people, 0.185m unemployed, 0.027m government trainees and 0.403m other inactive who had a LLTI. Surveys of male IB claimants (Beatty & Fothergill 1999) indicate that only one quarter (25%) say they cannot do any work, while two thirds (69%) say there are some types of work they cannot do. Among Job Seekers Allowance (JSA) claimants, the corresponding figures are 2% and 20%. Of course it is well established that prolonged unemployment does itself worsen peoples health (Bartley 1994, Shaw et al. 1999), and this must to some extent reduce the capacity of the long-term workless to return to work. This is particularly the case where, as in Britain, benefit levels are low (Sinfield 2001, Strandh 2001). But the evidence suggests that most sick workless people remain capable of taking jobs should they become available.
- There is a strong correlation across local authority areas (0.72 at May 1999) between the claimant unemployment rate and the proportion of the working age population claiming sickness or invalidity benefits (FIGURE 4). The areas with the highest sickness are former coal and steel towns where occupational illnesses probably are very high. But even in areas without such obvious problems, there are remarkably high levels of sickness. The DWP statistics show that 15-20% of the working age population of the big cities of Glasgow, Liverpool and Manchester are claiming sickness benefits. The gravity of the situation is obvious to local observers such as Alan Sinclair of the Wise Group who commented that government unemployment figures for areas of industrial decline are "hopelessly wrong". "In Glasgow, we talk about 22,000 people being unemployed. The figure is easily closer to 86,000" (The Herald, 23 June 2000). John Robertson MP, whose constituency includes Drumchapel, commented "The officially defined unemployed form only 16 per cent of the total in [Glasgow]" (Hansard, 30 January 2002, col.398). In Glasgow there has been no fall at all in the number of sickness benefit claimants since figures became available in November 1998, in spite of a considerable upturn in the local labour market.
- Beatty & Fothergill (1999) and Beatty et al. (2000) explain why movement of unemployed people on to sickness benefits is likely to be caused by the financial incentives created by the social security system. For those who have a medical condition enabling them to claim either JSA or sickness benefits, the latter will normally be the better option. This differential results from the strong belief of British policymakers, which took hold during the 1980s at the urging of supply-side economists such as Richard Layard, that unemployment benefits ought to be kept as low as possible in order to encourage people to move to employment. Sickness benefits, though scarcely generous, have not been affected in the same way. In this respect British policy is different from that of France and Germany, which have continued broadly to share Beveridges view that unemployment is as much a misfortune as is sickness. It does not appear to have occurred to the British advocates of lower unemployment benefits that people might respond rationally (as economists say they should) by moving to sickness benefits instead of jobs, where the latter are unavailable.
Beatty & Fothergill (1999) showed using individual level regression analysis that receipt of an occupational pension was a significant predictor of an IB rather than JSA claim. This was explained by the fact that because JSA is means-tested, it removed the benefit of the pension, whereas IB was non-means tested.
A local authority level regression analysis by the present author adds further evidence that the social security system itself is responsible for pushing unemployed people on to sickness benefits (Webster 2001b). The proportion of the working age population on sickness benefits at May 1999 can be explained to a significant extent by variations in the local level of social housing rents and council tax as well as lowest decile earnings and unemployment. The likely explanation is that because sickness benefits are counted as income for the purpose of calculating entitlement to Housing and Council Tax Benefit, fewer people in areas with high rents and council tax will gain financially from a move on to sickness benefits from JSA (or the gains will be smaller). This appears to be the main explanation why London boroughs have so much lower a proportion of their working age populations on sickness benefits than would be expected from their level of unemployment (FIGURE 4).
Similar effects operate in other countries. In relation to the Netherlands, Broersma (2000) notes that "People above 57 years old are no longer included in (the ILO) figure since 1983. Since then, these unemployed persons were no longer obliged to search actively for a job.....This explains the odd phenomenon that more people get an unemployment benefit payment than there are unemployed. By now, there are twice as many recipients as there are registered unemployed". In the USA, Autor & Duggan (2001) show that the large increase in disability benefit claims, especially among unqualified people, since 1984 is strongly related to a rise in the value of the benefits relative to relevant earnings, and to relaxed criteria for benefit award. They estimate that this has reduced the measured aggregate unemployment rate by at least 0.65 of a percentage point. The processes involved have been similar to those in Britain, although the proportions of the labour force involved in Britain appear to be some 50% greater than in the USA (Autor & Duggan 2001, Nickell & Quintini 2001). - It is well known that the DE for many years actively promoted the transfer of unemployed people on to sickness benefits in order to reduce the recorded level of unemployment. Such reclassification actually formed part of the performance targets of the Employment Service, being treated as a "positive outcome".
- At Spring 2000 just over a third (34.1%) of the 2.3m working age inactive sick in Great Britain said they wanted to work. As a proportion of the UK working age population, this is more people than are inactive sick in total in Germany or France. If these people were counted as unemployed, they would add 2.7 percentage points to the UK ILO rate, bringing it to the same level as Germany. However this almost certainly underestimates the extent of disguised unemployment among the sick. Beatty & Fothergill (1999, pp.29-30) noticed in their surveys that the more unfavourable the state of the local labour market, the lower the proportion of men on IB who said they wanted to work. The LFS evidence confirms this effect in relation to the inactive sick as a whole. In 1998-99 the proportion of the inactive sick wanting to work was about 39% in the lowest unemployment areas, but only around 33% in the highest unemployment areas (FIGURE 5). In other words there is a "discouragement" effect among the inactive sick as well as among the officially recognised "discouraged workers".
Even without making any allowance for this discouragement effect, adding the long term sick wanting work to the ILO unemployed would raise the ILO rate by 1.5% in the lowest unemployment areas, rising to 4.2% in the highest unemployment areas. The differential is large because although discouragement is greater in the high unemployment areas, the number of long term sick is very much greater. This brings the total undercount in the ILO rate - including government trainees, "discouraged" workers and the long-term sick wanting work - to about 2.5% in the lowest unemployment areas, rising to over 6% in the highest unemployment areas. This latter figure by itself is greater than the UK official average ILO rate (4.9% at Spring 2001). Adjustment for the discouragement effect among the sick would raise the level in the high unemployment areas still further.
ONS, Eurostat, the ILO Rate, and Sickness
Unfortunately no official agency has yet been prepared to concede that measured ILO unemployment rates are affected by the incentives created by different national social security systems to move into other differing categories of worklessness. ONS, Eurostat and the other governmental agencies all claim that ILO rates are comparable between countries. It is true is that ILO rates are estimated using the same procedure in each country. But following the same procedure in different circumstances does not necessarily produce comparable results. Beatty et al. (2000) say "because of the interaction with recorded sickness, conventional measures of unemployment are distorted. The distortion varies...from place to place, and probably from country to country as well...(it) applies...to the supposedly standardized...(ILO) measure...the probability is that vast sums of Objective 2 aid will be misallocated between regions and between Member States on the basis of flawed statistics. Countries where the ILO unemployed represent an unusually low share of the broader unemployed are likely to lose out. The UK falls into this category...in the UK the diversion into recorded sickness has been especially pronounced".
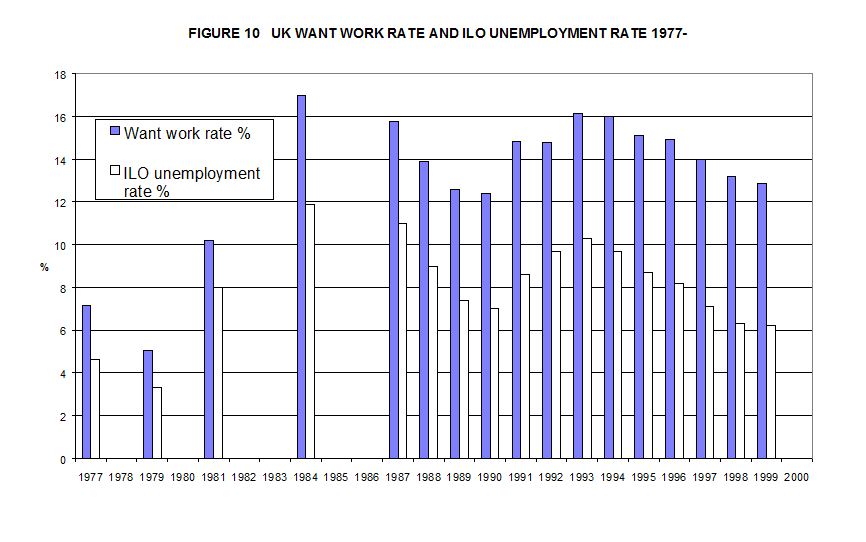
A "Want Work Rate" (WWR) can be derived from the LFS. It is the sum of the ILO unemployed and the economically inactive wanting work divided by the sum of all those in work or wanting work. It has some technical problems (Webster 2001b), but is a useful summary measure of the UKs overall worklessness from both a time series and an international perspective.
FIGURE 10 shows that the WWR in Britain is now much higher at over 12% than it was before the severe recessions of the 1980s and 1990s. By 1999 it had not fallen back even to the level of 1990, let alone that of 1981 or before. The UKs male WWR is the joint fourth highest in the EU, and its both-sex WWR in the highest unemployment regions is similar to that in the Italian south, rural Spain and the former East Germany.
In 1999, France had almost exactly the same WWR as the UK (13.0% compared to 12.9%). But France counts 91% of people not in work but wanting work as ILO unemployed, compared to the UKs 44%. This, together with the evidence cited earlier, strongly suggests that France is much better off in labour market terms than the UK. Because it has held on to the Beveridge principle of adequate unemployment benefits, it has maintained its unemployed people in a state of greater social inclusion and better health; and, whether overall worklessness is compared in terms of the WWR or of the sum of the ILO unemployed and the working age sick, this has led to a true rate of unemployment which appears to be no worse than Britains and may well be better.
However, by declining to look at overall worklessness rather than at the ILO unemployment rate, British official and academic commentators currently give a self-deceiving picture in which the UK is presented as having a particularly successful labour market record compared to other countries. The high levels of male inactivity due to sickness are presented as an incidental anomaly or "imbalance" which is not directly related to economic performance. The key text here is Nickell & Quintini (2001); the weaknesses in their argument are discussed in Webster (2001c). The same line of argument is used by the Treasury and DWP in HM Treasury (2001).
Misuse of vacancy data
During the last 2-3 years there has been an attempt by the government to argue that there is no shortage of jobs anywhere in Britain. This has depended on misuse of job vacancy data, in order to sidestep the evidence on the geographical concentration of worklessness by suggesting that there are enough vacancies to employ all the unemployed and that these vacancies are sufficiently evenly distributed across the country to deal with geographical concentrations. HM Treasury (2000) is the principal text arguing this case, but there was also an important 4-part story ("Jobs for the boys, but the boys dont want jobs"; "Tough Love: Brown is right to clamp down on the workshy") placed as an "exclusive" in the London Times of 7 February 2000 by the Chancellor of the Exchequer and based on an apparent surge in vacancies in the north east which was due to distortion by the trial of the Employment Direct scheme. ONS has now suspended the job vacancy series, precisely because of this distortion (Financial Times, 12/9/01), although DWP has insisted on continuing to use it. The weaknesses of the government argument are discussed in detail in Webster (2000b). However, the same type of argument was still being made, in a more muted way, by the Treasury and DWP as recently as last November (HM Treasury 2001).
Not all of the government argument on vacancies depends on misuse of statistics. In part, it is simple misunderstanding. One key point lies in a neglect of the different vacancy characteristics of different economic sectors: many services have higher turnover than traditional industries. The other important misconception - brought out in Codjoe (2001) - is based on lack of understanding of the spatial structure of local labour markets. It is argued that because high levels of vacancies are found in cities alongside high levels of unemployment, the unemployment cannot be due to lack of labour demand. But for the most part these vacancies merely represent turnover among the commuter workforce. Most British cities have central business districts with numerous, mainly white collar vacancies. This is why it is often true that "areas of high unemployment lie within easy travelling distance of areas where vacancies are plentiful". But the vacancies have to be set against the labour force in the citys whole commuting catchment area. Interestingly, comparisons of vacancies with unemployment are one of the few exercises for which TTWAs are in principle the correct geography (Webster 2000b; see also Webster 2000c).
Lone Parenthood
As a result of lack of attention to the geography of worklessness, as well as specific errors in the statistics, academics and officials have generally failed to grasp the crucially important relationship between unemployment and lone parenthood.
There is now overwhelming evidence that the huge rise of British lone parenthood since the early 1980s has been caused by the huge increase in male unemployment. This was a repeat of what had occurred earlier in the USA and had been quickly understood there by analysts such as Moynihan, Wilson and McLanahan & Garfinkel. Men without jobs are not, in the main, wanted as long-term partners. The British evidence is summarised in Webster (2000a), Holtermann et al. (1999), McKay & Rowlingson (1998), Gordon (1996) and Bradshaw et al. (1996). All of these papers were published after the present government, in opposition, worked out its policies, during 1993-95, in the first years of the Blair/Brown ascendancy and immediately after the Social Justice Commission report (1993). Lone parenthood can only be thoroughly studied using the Census, and at that time no systematic analyses of the 1991 Census results were available. Throughout its first term, the government focused on implementation of its preconceived policies, and it is only since June 2001 that some rethinking has started. This has not yet reached the areas of lone parenthood, or welfare, employment and economic policy more generally. Consequently the government is burdened with a view of the lone parenthood problem which is - because of the Census data delays - approaching two decades out of date.
A graphic example of the difficulties in the analysis of lone parenthood caused by errors in the unemployment statistics is contained in HM Treasury (2001). Understatement of the closeness of the relationship between lone parenthood and unemployment enables the paper to avoid facing up to its causal nature. It describes the doubling of lone parent families between the late 1970s and mid 1990s as "demographic" (3.20), i.e. independent of the economy. But the paper uses "workforce" unemployment rates instead of valid residence-based rates (which could perfectly well have been constructed for the purpose). According to Chart 3.16, there is a correlation of 0.73 across GB local authority areas of lone parents on Income Support (expressed as a percentage of the working age population) with the local unemployment rate.
But when the unemployment rate is corrected to be a true resident rate, the correlation turns out to be much higher, at 0.83 (FIGURE 6). The LFS data show that the very strong relationship between lone parenthood and unemployment across local authorities did not weaken between 1991 and 2000 (FIGURE 7).
The government sees the rise of lone parenthood as something which occurred in parallel with the rise of unemployment but not because of it. Misled like the former government of New Zealand (Goodger 1998) by spurious analysis, it has entertained the arguments of the US Right that lone parenthood has been encouraged by welfare benefits. This was the reason for its removal of lone parent benefits in December 1997, now seen as a key mistake of its first term. It still believes that welfare benefits for lone parents must not be raised to levels which would eradicate child poverty in this group, instead believing that an answer can be found by pushing and pulling lone parents into work through measures such as WFTC and "work-focused interviews".
The fact that lone parenthood rose closely in line with unemployment across areas means that this approach cannot work. It was loss of jobs from the affected areas which caused family breakdown; this same loss of jobs means that local labour demand is too weak to re-employ the large numbers of lone parents involved, even if this was the right approach (in fact re-employing the fathers ought to have much higher priority). Performance data on WFTC is already demonstrating this. While the overall rate of claim has increased in all areas, the increase over Family Credit at August 2001 was 20% of lone parent families in the lowest unemployment areas, compared to 10%
in the highest unemployment areas (FIGURE 8 details of methodology in Webster 2001d). This relative position reflects the fact that the proportion of lone parents in work was already twice as high in the lowest as in the highest unemployment areas, again a position which was unchanged between 1991 and 2000 even though the proportion in work rose by around 10% across the board (FIGURE 9). The reality is that without a major increase in labour demand in the areas where the bulk of them live, not enough lone parents can be got into work to make subsidised employment a viable strategy to address child poverty. To attain the governments target of a 70% employment rate for lone parents in the next decade would require negligible further increase in the most prosperous areas, but a virtual doubling in the poorest areas - an increase three times greater than in the last decade.
Failure to register the connection between lone parenthood and unemployment has created major problems in official demographic forecasting. For instance, the official Scottish Executive 1998-based projections for Glasgow, based on blind extrapolation of past trends, imply a doubling of the current number of lone parent families over the next 10 years. This would be a social catastrophe if it were to occur. But it is extremely unlikely. Because unemployment topped out in the mid-1990s, so did lone parenthood and the current trend is of no increase over a figure one third lower than the 1998 base assumed in the projections.
The consequences
The evidence clearly indicates that Britain has a huge problem of unemployment, associated with massive problems of working age sickness and family breakdown, all heavily concentrated in areas of industrial decline and caused by a collapse in demand for labour caused by that decline (Webster 1998, 2000b, 2001b). But Whitehall policy makers, most academics, and influential sections of the public, are caught in a vicious circle. The various statistical misrepresentations have strengthened the views of "supply-side" theorists of unemployment. In so far as the role of deindustrialisation and labour demand deficiency is acknowledged at all, it is in terms of a non-spatial decline in the demand for "low skilled" labour rather than in the demand for labour overall. This perspective in turn has undermined interest in realistic description of the geographical pattern of unemployment at sub-regional level, and made it more difficult to reform the statistics.
There is excessive emphasis on supply-side labour market policies aimed in a blanket way at all the workless. These are being pursued at the expense both of urgently needed investment in physical infrastructure in areas of industrial decline, and of policies for those with genuine labour market handicaps, who have suffered from the withdrawal of properly funded programmes such as the Community Programme which previously targeted them. There is too little emphasis on urban and regional policy, leading to a combination of excessive labour market tightness in prosperous areas such as the outer south east and excessive looseness in areas such as Glasgow (RSA 2001). Most fundamentally, the adverse effects of the decline of manufacturing are being greatly underestimated. This decline has been far greater than in other OECD countries; Bob Rowthorn notes that since 1973, British and UK manufacturing output have increased by 14% and 114% respectively (Rowthorn 2001; see also Rowthorn 2000). Consequently, overvaluation of the pound is seen as less serious than it is, other policies are insufficiently supportive towards manufacturing, and there is too much emphasis on monetary as against fiscal policy in managing the economy.
It is hard to see the current set of official policies being effective. Significantly, Nickell & Quintini (2001) are pessimistic about the prospects for the problem of male working age sickness.
Why are the official unemployment statistics so misleading?
What are the reasons why British official statistics have come to present such a misleading picture of the countrys unemployment problem?
Clearly there are some technical factors at work. To a considerable extent we are dealing with a novel problem. There has never previously been such a large group of people claiming sickness benefits who in other respects appear to be unemployed; hence the problem of measurement is a new one. Since this problem emerged only in the mid-1980s, both in the UK and in other countries such as the USA and the Netherlands, it was not unreasonable in 1984 to adopt an ILO definition which did not take account of it. Similarly, the problem of defining local labour markets has been greatly exacerbated by the huge increase in long distance commuting over the last 40 years; 1961 TTWAs were not nearly so bad as those defined in 1998. Technology has also been a problem. It is difficult to resolve the problems in the local official unemployment series without full postcoding of data, which was only introduced in 1993 (although underfunding may have played a part here).
Bureaucratic inertia has also played an important part, particularly in the TTWA system which has evolved over three quarters of a century. Inertia has been greatly increased by the Whitehall convention of giving "ownership" of statistics to individual departments - in this case the DE. The ILO, OECD and Eurostat, who must share responsibility, also appear strongly affected by inertia. In the case of ILO rates, ONS has succumbed to the temptation noted by Thomas (1998b), of claiming that conformity to an international standard of itself guarantees statistical integrity, whether or not the statistic actually contribute to understanding the conditions of society.
However, these are not full explanations. Some of the worst misrepresentations are of recent origin, with the "workforce" statistics dating only from 1996. And it can scarcely be an accident that the misrepresentations taken together are such as to advance a particular supply-side view, namely that UK economic performance has been good, the loss of manufacturing does not matter, and worklessness is primarily due to deficiencies in the workforce or in the social security system rather than to decisions by investors or the government.
The role of the Thatcher administrations was fundamental. Margaret Thatcher was quite open in her disbelief in the value of an independent civil service. She regarded it as part of an outdated establishment which had to be overthrown. Famously, appointments and retirements were used to install people of whom it could be said that they were "one of us". The internal climate within the civil service became intellectually repressive; this became clear when after a year or two of John Majors premiership, civil servants privately started commenting with relief on the disappearance of what they called the "thought police". Thatchers own thoughts on unemployment were remarkably simplistic (Thatcher 1993). Although she was told about the role of the high pound under Geoffrey Howe (p.52), she preferred to explain it in terms of excessive wage rises (p.52), demographic factors increasing the labour force (p.154), overmanning and inefficiency, strikes, technological change, changes in the pattern of world trade, the international recession (p.292) and "council estate culture" (p.671). In this climate, statistical work in government was not going to get very far if it pointed to the role of deindustrialisation in promoting unemployment.
Thatcher thought that recovery could be achieved by reducing government (p.148) and among the reductions were huge cuts in the government statistical service, whose staffing was reduced by 53% over her first decade, with "employment etc" cut by 78% (RSS 1990). These followed the 1980 Rayner review of the government statistical service. Muriel Nissel, in an article commissioned but then dropped from Social Trends as too controversial (Nissel 1995), explained the hugely damaging impact which Rayner and the associated political changes had on government statistics. Rayner introduced the doctrine that "in general there is no more reason for government to act as universal provider in the statistical field than in any other". The idea of a general duty to inform public debate was replaced by the notion that statistics had to have a paying customer, either the government itself or an outside group with the money to buy them. In relation to government statistics, the public were reduced to the status of onlookers through a "window".
Nissel pointed out that statistics divisions within departments were made to focus more narrowly on immediate policy needs, statisticians became more cautious, material was more carefully screened before going outside and policy branches were given more influence over the statisticians. Overall, the status of statisticians within government was greatly lowered. Nissel singled out DE in particular as insisting on changes to an article about unemployment in Social Trends, which failed in those years adequately to disclose growing inequality, largely resulting from higher unemployment.
At the same time, the efforts of DE and the Employment Service came to be directed very substantially towards the concealment of unemployment. The junior Employment minister Alan Clark, writing in relation to 1983, reveals a good deal in referring to "these tacky schemes to get people off the Register" (Clark 1994, p.22), although he does not suggest manipulation of the statistics as such.
As Nissel notes, there was a gradual relaxation under John Major. But the effects of the Thatcher period are still powerful today, not least because very little new money has come into the government statistical service and much of that has been tied to a policy agenda, such as sorting out the gross unreliability of earnings data or introducing national "neighbourhood" statistics. The civil service had come to be strongly influenced by Thatchers outlook, and in particular found it difficult to acknowledge the damage done by deindustrialisation because of its shared responsibility for it. And the habits of policy influence over government statistics which became established in the 1980s have proved enduring. The then Employment Minister Tessa Jowell responded to the comments by Alan Sinclair in 2000 quoted earlier by saying "Unemployment figures are independently audited". This may be true in principle but it is not yet the case in reality. ONS to date has re-examined very few issues, and these have not included the question of treatment of the sick and its implications for interpretation of the ILO rate. Good practice is returning very slowly. Thatchers legacy was not just mass unemployment on the ground. It was also a government machine unable to describe the problem accurately.
Because of their closeness to the processes involved, local authorities are better able than central government to understand the causes of their unemployment problems. But one of the major trends of the past 25 years has been the reduction in their power and status. This started in the mid-1970s as a straightforward rolling back of the financial expansion of the 1960s, but under Thatcher and Blair became a much more conscious assault on the governmental role of local government. Local government has been weakened by the fact that businesses have become less attached to particular places, as also have individuals, who are geographically more mobile. Local authorities in their weakened state are seen by government statisticians as a less important client, so that fewer resources have been put into producing good quality statistics at local government level; it is striking that development of neighbourhood level statistics one of whose functions is to allow central government to bypass local government - has been given higher priority than resolution of the blatant inadequacies of statistics at the local authority and local labour market levels. The government for whose needs Rayner said statistics should be produced never included local government (Hoinville & Smith 1982, p.199).
At the same time, the independence of university researchers has been undermined by changes in financing. They have been made much more dependent upon winning government contracts, while direct public financing has been made dependent upon the Research Assessment Exercise (RAE). This promotes publication at all costs, making it difficult for researchers to spend time on unpopular lines of inquiry in which publication may be delayed or blocked by referees objections, and causing the journals to fill up with mediocre material.
Changes in the economics profession have also played an important role. The last 40 years have seen the rise to dominance of mathematics and econometrics-based economists who are primarily interested in modelling, and the almost complete demise of the older type of "applied economist" who had a broad knowledge of business and affairs. Economists have become much narrower and have largely lost such interest in spatial matters as they previously had. The focus on modelling is so strong that inquiry into the validity of data sources, or the relevance of models to the real world, are regarded as tasks for lesser minds. The employment of economists has changed, with far more jobs concerned with the analysis of financial markets and relatively fewer concerned with human welfare; many if not most economic commentators on unemployment are employed by the financial services industry. At the same time, geographers and physical planners have lost status, influence and self-confidence, leaving the field of unemployment more completely under the control of non-spatial economists. Economists as a profession have been strong advocates of deindustrialisation, and find it difficult to admit its adverse effects.
These trends have left the official statisticians largely without effective academic critics. Many influential academics regard local unemployment statistics which are particularly crucial given the nature of the British problem - as being beneath their attention, while many of those who do understand them are too depend on government contracts to argue.
Supply-side policies have themselves created groups with an interest in their perpetuation. When Michael Foot as Employment Secretary first introduced temporary employment schemes in the mid-1970s, they were not claimed to be a solution. They were simply thought to be better than leaving people with nothing to do. But as time has gone on, the claims for their efficacy have become more vigorous and harder to challenge. The DE itself owes its survival (in various incarnations) largely to the continued government commitment to supply-side policies and has a vested interest in justifying them.
Economic theories which attribute responsibility for unemployment to the unemployed themselves naturally tend to appeal to many (though of course not all) business interests. This is illustrated by the views of the Institute of Directors (2000). More specifically, the decline of manufacturing has created a vicious circle in which manufacturing interests are no longer strong enough within business to protect themselves. The turning-point here was probably Campbell Adamsons "bare knuckle fight" speech to the 1981 CBI conference, which had the unintended effect of revealing that a majority of the organization no longer thought that manufacturing mattered. Not only does the UK now have relatively few manufacturing companies; manufacturing is no longer considered a core activity even by most of them. Within those companies power has shifted from those involved with production, such as engineers, to those concerned with finance, such as accountants.
The unemployed themselves have very little power to influence their treatment. As a result of benefit cuts, they are much poorer and more stressed than before. Because of the nature of the unemployment problem, they are heavily concentrated in areas which are seen as unimportant in the political system because their voters "have nowhere else to go". And supply-side programmes must affect their own attitudes, by constantly delivering the message that their problems are due not to structural factors in society but to their own inadequacies.
The current situation is in fact exactly what could be predicted from consistent application of the Rayner doctrine that the only statistics that should be produced are those that have a "market", either in or out of government. There is clearly a substantial market for statistics supporting a supply-side view; a legion of interests are looking for them. But what is the market for statistics truthfully showing the situation of the unemployed - poor, predominantly manual workers as they are, living in declining areas of the country without effective influence in the political system?
What can be done about it?
In the light of the balance of interests just outlined, it is unlikely that further improvement in the official unemployment statistics will come about as a result of specific political action aimed at this result, at least until, with the passage of time, the ineffectual character of the supply-side policy package becomes too obvious to deny. The only realistic immediate way forward is to pursue the general programme for reform of official statistics with which Radical Statistics and the RSS are both associated. This comprises an independent government statistical service on a statutory basis, with much better funding. One recent estimate by a lay adviser to ONS from the business community was that an adequate suite of labour market statistics would cost an additional £50m per year.
There has already been some progress. Although both inadequate and inadequately supported by ministers, the Statistics Commission and the Framework for National Statistics (June 2000) are an advance on what went before. The Framework does reinstate the public service principle that the primary aim of the government statistical service is to provide "a comprehensive and meaningful description of the UK economy and society", and the influence of the Rayner doctrine is visibly waning. As noted earlier, there have been modest but encouraging specific moves by ONS in relation to the vacancy and "workforce" unemployment statistics, involving the assertion by ONS of its independent role against the "departmental ownership" claims of DE (now Department of Work and Pensions).
There is a general acceptance that, as Nissel said, "Genuine democracy must be based on sound and reliable information". Although there is not much of a constituency for better unemployment statistics as such, there is quite a strong constituency for better official statistics in general. This is where hope must lie.
REFERENCES
The unemployment research website at www.jiscmail.ac.uk/lists/unemployment-research contains many relevant discussion pieces.
Autor, David H. & Duggan, Mark G. (2001) The Rise in Disability Recipiency and the Decline in Unemployment, Cambridge, Mass., National Bureau of Economic Research, June
Bailey, Nick & Turok, Ivan (2000) Adjustment to Job Loss in Britains Major Cities, Regional Studies, Vol.34 No.7
Bartley, Mel (1994) Unemployment and ill health: understanding the relationship, Journal of Epidemiology and Community Health, 48
Beatty, Christina et al. (1997) Geographical variation in the labour-market adjustment process: the UK coalfields 1981-91, Environment and Planning A, Vol.29
Beatty, Christina & Fothergill, Stephen (1999) Incapacity Benefit and Unemployment, Centre for Regional Economic and Social Research, Sheffield Hallam University, July
Beatty, Christina et al. (2000) A Theory of Employment, Unemployment and Sickness, Regional Studies, Vol.34.7
Bradshaw, N. et al. (1996) Area Variations in the Prevalence of Lone Parent Families in England and Wales: A Research Note, Regional Studies, Vol.30 No.8
Broersma, L. et al. (2000) Labour supply, the natural rate, and the welfare state in the Netherlands: the wrong institutions at the wrong point in time, Oxford Economic Papers 52
Clark, Alan (1994) Diaries: In Power, 1983-1992, London, Phoenix
Codjoe, Catherine (2001) Getting People without Jobs into Jobs without People: The Geography of the GB Labour Market, Government Economic Service Conference paper, DWP, July
Department of Trade & Industry (1999) The Governments Proposals for New Assisted Areas, July
Erdem, Esra & Glyn, Andrew (2001) Job Deficits in UK Regions, available at www.economics.ox.ac.uk/Members/andrew.glyn Other reports of this work are in Dickens, R. et al. (eds) The State of Working Britain Update 2001, York Publishing, 2001 and in Vol.II of the House of Commmons Jobs Gap report (see Institute of Directors 2000, below)
Fieldhouse, Edward Hollywood, Emma (1999) 'Life after Mining: Hidden unemployment and changing patterns of economic activity amongst miners in England and Wales, 1981-1991', Work, Employment & Society, Vol.13 No.3, September
Fothergill, Stephen (2001) The True Scale of the Regional Problem in the UK, Regional Studies, Vol.35.3
Garside, W.R. (1980) The Measurement of Unemployment: Methods and Sources in Great Britain 1850-1979, Oxford, Blackwell
Goodger, Kay (1998) Explanations for the growth of sole parent benefit numbers in the 1970s in New Zealand, Radical Statistics No.69, Autumn
Gordon, Ian (1996) Family Structure, Educational Achievement and the Inner City, Urban Studies, Vol.33 No.3
Green, Anne E. & Coombes, M.G. (1985) Local Unemployment Rates: Statistical Sensitivities and Policy Implications, Regional Studies, Vol.19 No.3
Gregg, P. (1994) Out for the Count: a Social Scientists Analysis of Unemployment Statistics in the UK, JRSS A, Vol.157 Part 2
HM Treasury (2000) The Goal of Full Employment: Employment Opportunity for All throughout Britain: Trends in regional and local unemployment and vacancies and unemployment, February
HM Treasury (2001) The Changing Welfare State: employment opportunity for all, November
Hoinville, G. & Smith, T.M.F. (1982) The Rayner Review of Government Statistical Services, JRSS A, Vol.145 Part 2
Holtermann, Sally et al. (1999) Lone Parents and the Labour Market: Results from the 1997 Labour Force Survey and Review of Research, Sheffield, Employment Service ESR23, August
Institute of Directors (2000) Memorandum of Evidence to the House of Commons Education and Employment Committee Inquiry Employability and Jobs: Is there a jobs gap?, Fourth Report 1999-2000, HC 60-II, London, Stationery Office
Layard, Richard, Nickell, Stephen & Jackman, Richard (1991) Unemployment: Macroeconomic Performance and the Labour Market, Oxford University Press
MacKay, R.R. (1999) Work and nonwork: a more difficult labour market, Environment and Planning A, Vol.31
McKay, Stephen & Rowlingson, Karen (1998) Choosing Lone Parenthood? The Dynamics of Family Change in R.Ford & J.Millar (eds) Private Lives and Public Responses, London, PSI
National Audit Office (1989) Invalidity Benefit, London, HMSO, December
Nickell, Stephen & Quintini, Glenda (2001) The Recent Performance of the UK Labour Market, Economics Section, British Association, Glasgow, 4 September (available on the Bank of England website at www.bankofengland.co.uk and forthcoming in Oxford Journal of Economic Policy)
Nissel, Muriel (1995) Social Trends and Social Change, JRSS A, Vol.158, Part 3
ONS (2000) Framework for National Statistics, June
Regional Studies Association (2001) Labours New Regional Policy: An Assessment, Seaford, November
Rowthorn, Robert (2000) The Political Economy of Full Employment in Modern Britain, Oxford Bulletin of Economics and Statistics, May
Rowthorn, Robert (2001) Manufacturing matters, The Guardian, 5 November
Royal Statistical Society (1990) Official Statistics: Counting with Confidence, Report of a Working Party on Official Statistics in the UK, July
Shaw, Mary et al. (1999) The Widening Gap: Health Inequalities and Policy in Britain, Bristol, The Policy Press
Sinfield, Adrian (2001) Benefits and Research in the Labour Market, Conference Paper, Labour Market Change, Unemployment, Welfare and Citizenship in Europe, Helsinki, 20-25 April
Strandh, Mattias (2001) State Intervention and Mental Well-being among the Unemployed, Journal of Social Policy, 30
Thatcher, Margaret (1993) The Downing Street Years 1979-1990, London, Harper Collins
Thomas, Ray (1998a) How enlarged travel to work areas conceal inner city unemployment Radical Statistics 67, Spring
Thomas, Ray (1998b) Integrity for statistics or for statisticians? A critique of Statistics: A Matter of Trust, Radical Statistics 69, Autumn
Turok, Ivan & Edge, Nicola (1999) The Jobs Gap in Britains Cities: Employment Loss and Labour Market Consequences, Bristol, The Policy Press
Webster, David (1998) Local Unemployment Statistics and the Diagnosis of Britains Unemployment Problem, BURISA No.134 (British Urban and Regional Information Systems Association), September
Webster, David (1999) Corrections for 1998 TTWAs, at www.jiscmail.ac.uk/lists/unemployment-research, 3 February
Webster, David (2000a) Lone Parenthood: Two Views and their Consequences, in Isobel Anderson & Duncan Sim (eds.), Social Exclusion and Housing: Context and Challenges, Coventry, Chartered Institute of Housing
Webster, David (2000b) The Geographical Concentration of Labour Market Disadvantage, Oxford Review of Economic Policy, Vol.16 No.1
Webster, David (2000c) Cambridge Econometrics on Skills Mismatch, at www.jiscmail.ac.uk/lists/unemployment-research, 9 September March
Webster, David (2001a) Corrected claimant unemployment rates for local authorities, January 2001, at www.jiscmail.ac.uk/lists/unemployment-research, 29 March
Webster, David (2001b) Inequalities in the Labour Market, paper presented to the Social Policy Section of the British Association Festival of Science, Glasgow, 4 September 2001.
Webster, David (2001c) Unemployment, the Working Age Sick and the "Natural Rate": Some Comments on a Paper by Stephen Nickell, at www.jiscmail.ac.uk/lists/unemployment-research, 29 November
Webster, David (2001d) Bringing People into Work, Reducing Child Poverty? Working Families Tax Credit and the Geography of Worklessness, University of Glasgow Department of Urban Studies seminar paper, June
Webster, David & Turok, Ivan (1997) The Future of Local Unemployment Statistics: The Case for Replacing TTWAs, Fraser of Allander Institute Quarterly Economic Commentary, Vol.22 No.2, University of Strathclyde, March
Young, Mike (2001) Time series analyses of the Labour Force Survey two-quarter longitudinal databases, Labour Market Trends, August
ACKNOWLEDGMENTS
Some of the material in this paper was previously presented to the British Association Festival of Science, Glasgow, September 2001. The author would like to thank Dr Ray Thomas for producing MAPS 1 and 2, and Dr Humphrey Southall for pointing out the significance of the Ministry of Labours Local Unemployment Index.
NB. David Webster is Chief Housing Officer (Policy Review and Development), Glasgow City Council. The views expressed here are not necessarily those of the Council.