Contents of this Issue
There is one poem, three papers and one book review in this issue. In addition to a poem for and paper from Roy Carr-Hill (see below), Zohreen Badruddin worked with Diana Kornbrot to convert Diana’s RadStats conference paper on the infrastructure needed for Universal Basic Income (UBI) into the one published here. This is followed by a paper by Sean Demack on HE equality analyses involving ethnicity which reveals several (onion) layers of problematic statistical practice. Finally, Irina Motoc reviews a book on data visualization by Maarten Boers.
Roy Carr-Hill 1943-1922
 A founding member of Radical Statistics and, for the last decade, lead editor of this RadStats journal / newsletter, Roy died suddenly in November 2022. Family and friends gathered to remember Roy at a humanist funeral in York crematorium on a frozen Friday 9th December. The music of Paul Simon, Bob Marley and from The Blues Brothers accompanied moving memories of Roy’s life from four daughters and a grandson (and others later in The Woodman pub). To mark the death of Roy, this issue includes the John Dryden poem that was read at his funeral and a re-print of one of his RadStats articles in which he wryly summarised the rich and radical life he had lived up to 1999 when it was first published (RadStats Issue 71). I assume that Roy celebrated his 16th election of not voting in 2019!
RadStats Journal / Newsletter
For the last few years, I have helped Roy to put this journal / newsletter together. Irina Motoc joined us more recently to focus on increasing the volume of book reviews submitted & published. With the help of Eileen Magnello (copy editor) and Alistair Cairns (administrator), we have published 3-4 editions of the journal each year. The future of the RadStats journal is dependent on submissions from members and other interested parties. In addition to articles (and other submissions), if you are interested in becoming part of the editorial team, please contact us using the details below.
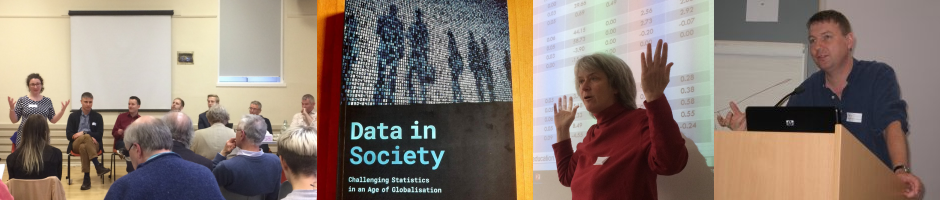
Radical Statistics Conference 2023
The conference [was] held on March 25th in Sheffield and the first in person RadStats event for three years. The conference has a broad theme of ‘Radical Statistics in an Age of Uncertainty’ and will include presentations on hidden unemployment, civic statistics, and pupil segregation. Please visit https://www.radstats.org.uk/conference/Sheffield2023/ for more detail.
Getting Involved
The RadStats group is as strong as its membership and we welcome offers of help. If you are interested in becoming involved with the journal, a future conference or event or other ideas to advance the Radical Statistics aim of building a more free, democratic, and egalitarian society, please contact editors@radstats.org.uk.
RadStats are particularly concerned about
- Mystifying use of technical language to disguise social problems.
- Lack of control by the community over what & how statistical investigations are conducted and interpreted.
- Power structures within which statistical and research workers are employed.
- Fragmentation of social problems into specialist fields, obscuring connectedness.
“We believe that statistics can be used to support radical campaigns for progressive social change. Statistics should inform, not drive policies. Social problems should not be disguised by technical language.”
We currently have no proposed articles for the next issue (RS 135); We encourage presenters at the conference in Sheffield to submit an article for consideration. Our review editor, Irina Motoc has several books for review, and is seeking volunteers!
Administrative Issues
Please make sure you have updated your subscription, or make a donation! – by going to www.radstats.org.uk/membership/ where you can pay by cheque, standing order, PayPal – or by filling in your details on page 45.
Editorial Team (editors@radstats.org.uk)
Sean DEMACK
Please email if interested in joining this team.
Review Editor
Irina MOTOC (irinamotoc@gmx.com)
 ,
, 

